Ichimoku cloud
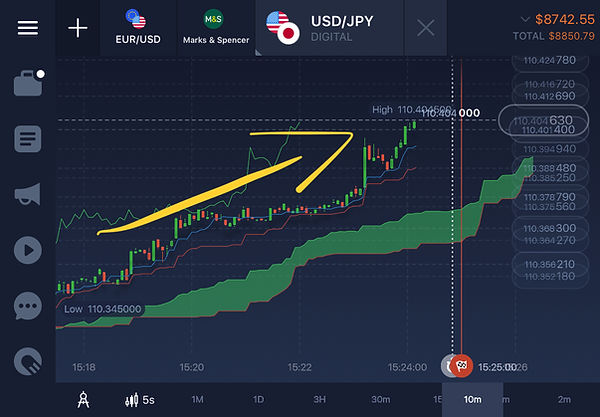
At first glance, the Ichimoku Indicator looks extremely confusing. So many lines and shaded areas. Take a look at the image below.....

So then how does this indicator help a trader? The Ichimoku helps you to look for future price momentum, as well as areas of support and resistance.
Let's break down this Indicator so that you can understand it better. Oh, by the way, the Ichimoku is mostly used for trading JPY pairs (USD/JPY, EUR/JPY, and GBP/JPY for example).
Before we continue, make sure you download IQ Option so that you can begin to use this indicator (and others). Choose the platform you use below.
RISK WARNING: YOUR CAPITAL MAY BE AT RISK
Alright, let's get into it. The image above shows three lines and two shaded areas. There's a blue, green, and a red line.
-
Kijun (blue)
This is the standard (or base) line.
-
Tenkan Sen (red)
This one is a tuning, or conversion line.
-
Chikou Span (green)
Also known as the lagging line.
-
Senkou Span
The shaded areas you see on the chart (red and green) are known as the Senkou Span.
how to trade with the ichimoku
Let's have a look at the Senkou Spans first of all. if the candlesticks are situated above the Senkou Span, then the first line will serve as the 1st support level, whilst the second one acts as the 2nd. If they are below, then the bottom line is taken as the 1st resistance level, whilst the top one is the 2nd.
-
UPTREND/DOWNTREND
When the price chart is above the 'cloud' (Senkou Span), this usually implies an uptrend (bullish). The image below clearly demonstrates this. Conversely, when it's trading below the cloud, then it's a bearish trend (downward).

-
TREND REVERSAL
When you see the price crossing the Senkou Span (the cloud), then this usually signals a trend reversal, as shown in the image below.

-
TREND STRENGTH
When the Senkou Span is thick, the chances of the price penetrating it are diminished, so any possibility of a trend reversal may be low as well. If you see a thin cloud, then this implies that the trend is losing strength. However, this doesn't automatically mean that there will be a trend reversal.

-
NO TRADE ZONE
How does one know when not to enter a trade whilst using the Ichimoku? Simple. Whenever you see the price chart inside the cloud, don't bother trading. It's best to observe what will take place next.

There you have it with a short introduction of the Ichimoku Cloud indicator. At first glance, it looks like a seismograph, but hopefully, now you can put it to practice. Make sure you have downloaded IQ Option so that you can start using this interesting indicator. Remember to use it mostly with JPY pairs.
The Ichimoku is a complete indicator, but you may want to confirm the signals with the help of others, such as the ADX or the KDJ for instance.


